One of the dark arts of measurement
This is part three on a series exploring metrics that can position a Community program as a successful business investment. Part one gives an overview you may want to read first.
Batteries Not Included
When making a case for further investment, **Share of Voice **(SOV) has a lot to offer. Said simply, SOV is the percentage of any conversation that’s about you. It’s a zero-sum measurement, meaning that more for you means less for the competition. That tends to get executives competitive mindset excited. It also tends to be misused, resulting in your metrics seeming less valuable in the process.
Share of voice only works if you can agree to its implied assumptions:
- The more conversation about you, the better (requires accepting the adage ‘there is no such thing as bad publicity’).
- Your competitors are measurable in the same way you are (no thumb on the scale by ignoring their data; leadership tends to notice it).
- You have a trusted and repeatable system of measurement (ideally software used by multiple teams for multiple programs).
- And like all our measurements, your business actually cares about the metric improving (best way to be sure: ask if your program will get more funding if it does improve; more on that later). If these statements are not applicable to your situation, abandon SOV immediately. It’s not for you at this moment. Rely on anecdotes or something–anything–else.
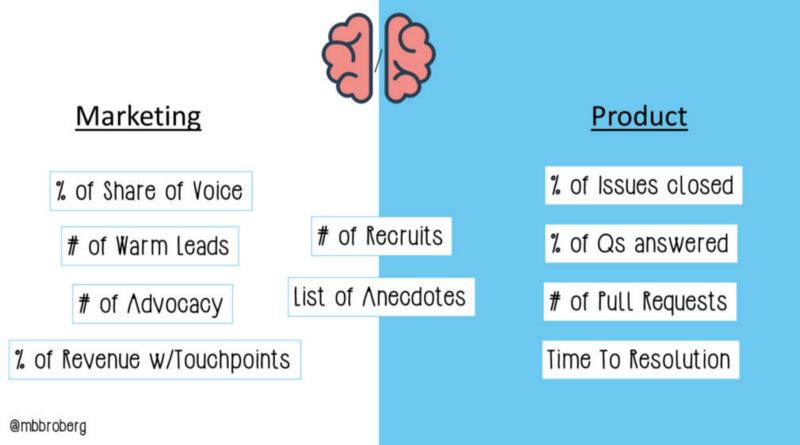 A reminder of some of my favorite options for community measurement.If you are in a situation where share of voice may resonate, then you’re in for a treat. SOV is relatively easy to measure, given you are using standard tools, and it pairs well with the ROI of fun stuff like product launches and conferences.
Practical Examples of Share of Voice
I’ll offer you two stories to give you an idea of how SOV can make a difference to your Community program.
1. Putting the Key in KPI
When creating a brand advocacy program, I searched out what key performance indicator would resonate with the executive sponsors. The team split responsibilities between Marketing and Support. These organizations have straight forward metrics, but they didn’t prove right for what we wanted to accomplish.
MQLs or other measurements of Marketing funnel are always tempting but were best to avoid. Our advocates were either already customers or unlikely to become one. Churning our advocates or their audience through the marketing funnel was a recipe for disaster for our program and was sure to pick a fight with other teams (Demand Gen in particular). Better to avoid it in this case.
So we shopped around, asking the tough questions to our leadership to confirm what would be of value, realistic, and quantifiable. For each metric found, the proposition took the form of this:
“We are at X. If we got it to Y, how might you invest in the program? Headcount? Budget? How about if we get to Z?”The litmus test proved valuable.
Should we focus on case deflection? The Support leadership liked it, but they also wouldn’t agree to a metric where they’d invest further in the program. Said another way: it was measured but never valued monetarily.
Should it be social bumps like “likes” or RTs? While those were reported on regularly, neither of them alone is valued monetarily. We had to get more creative. The answer showed up in the least likely of places.
I was looking over the shoulder of a Public Relations (PR) team member who was running a social media report through software I had never heard of. What I found out is that all PR programs focused on awareness were measured through this tool. Also, all PR programs were either invested in or canceled based on the metrics, which measured the relative share of voice between our company and the competition on each topic. This was our moment: this metric was trusted throughout the executive level as a meaningful measurement of results.
We had the tooling and now we needed to refine our pitch.
There was an opportunity: an internal initiative to grow the impact of product launches and customer events. So we combine the two and started to share. The brand advocacy program focused on SOV growth for those two activities, launches and events. We would be funded further if we had a meaningful impact on the company’s overall SOV.
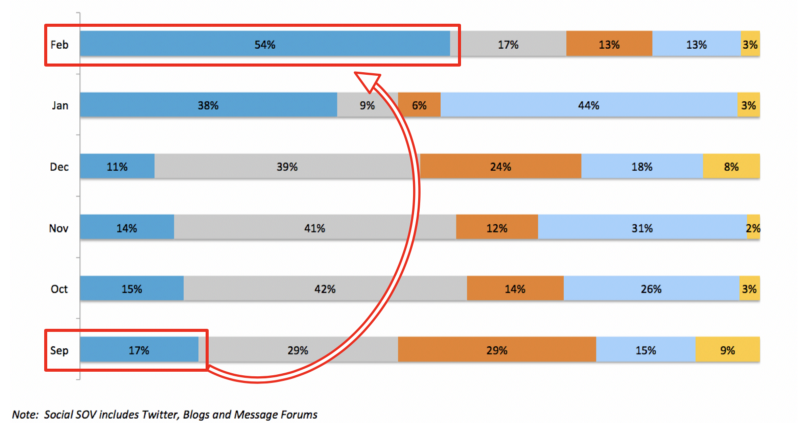 One report from that time. The different colors compared my company’s SOV to competitors for a set of keywords around a topic of interest for a launch (in this case, Big Data). September was when they launched a project on their own. February was when the brand advocacy program supported a launch.This measurement alone got us through 2 years of investment while I was head of the program. It took visualization, storytelling, and a great deal of cross-org communication. But it worked, and we had a blast doing it.
2. Finding Internal Competition
There are times when a competitive share of voice analysis is of no interest. The graphs aren’t as interesting when you already dominate your competitors in a keyword, for example. Sometimes, the only real competition is yourself. If we focus on the goal of funding a Community program, there is still an opportunity to made a powerful statement with data.
We began comparing the brand advocacy program’s SOV not just to the competition, but to ourselves. It feels obvious to say now but at the time it was a huge awakening. Before this point, I gave the absolute value of the advocate’s impact and our company’s relative position against the competition. Example: We produced 50,000 impressions daily, with the company’s SOV at 45%, 12% over our closest competitor.
It was good for a while, but I eventually found that no one but us knew how hard 50k impressions were to get. The raw numbers meant little in the mixed context of percentages. The new report read: we came in at 45% SOV, 12% over our closest competitor. Of the 45%, 50% of it was generated by interactions with our advocates. And I would have a freaking pie chart (there’s no shame in a good pie chart).
That added fuel to the fire: we can produce SOV at a decent quantity as well as higher quality, given we’re engaging influencers who all have their own unique voice. They also avoid the mistake of mob copy-paste prescribed tweets that bore customers and pad the numbers (we spoke about those on The Geek Whisperers).
In front of the right audience, an argument of sustaining 50% of the company’s share of voice with a small financial investment, added to the visible difference in quality, makes for a relatively easy budget discussion.
Not Everything That’s Counted Counts
Many measurements are not worth the time spent gathering them. I find SOV in a competitive organization on the more Enterprise side is a valuable metric to keep in mind. The challenge to it is that SOV is nothing more than a percentage of an overall measurement. You have to know what to measure, under what circumstances, how to present it, and to whom.
I hope the anecdotes give you a place to begin. Reach out to me if you need to think through it further.
More articles worth reading on SOV from:
- Brand Watch — How to Measure Share of Voice: PPC, SEO & Social Media
- Moz — How to Calculate Share of Voice for Organic Search
- TrackMaven — All about SOV
This article was originally published on Medium