What makes Snap different?
That’s the right question to ask and one I answered hundreds of times in the last couple weeks. It began at O’Reilly Velocity as Ops-minded teams were curious about the introduction of Snap to the Open Source toolkit. The conversations continue this week at (my first) Monitorama, which is the most amazing Operations-centric conference I’ve ever attended. There are a lot of familiar faces across the two and for good reason: people want to understand the how and why of data center operations.
But to the question at hand: why Snap vs this or that?
 Me making hand motions while I demo Snap at Velocity Conf 2016.It’s about the API. The design of Snap allows for the collection, processing and publishing of telemetry AND the administration of it to be managed. And that makes all the difference.
“Give me a for instance.”
Okay, let’s get concrete. You have a site outage. Your monitoring shows that you have an issue with your database, but your day-to-day view of the problem is at a lower granularity than you need to find the culprit. That’s common — most people monitor at a 1 to 5 minute fidelity, but like to get down to 1 *second or less *during an issue. How do you add this greater visibility into the database? Well, you usually need to setup an entirely new telemetry system to even see the same stats at a greater granularity (let alone *new *metrics). That means installing software on servers that are in production and having issues as we speak. Alternatively, with Snap, we can stream stats directly to Grafana.
 #### Configuring my environment for *ad hoc *queries
Let’s set something up and take a look around. We need Grafana and Snap running at a minimum, so here is the quick way to see the power of the API.
I’ve covered how to get Snap running in a few different ways, so I’ll skipping repeating it here. If you’d like to take this part step-by-step, see this tutorial. If you want to take the source code route, run through this refresher on environment configuration for Go development. You can also follow practices outlined under Running Snap to install snapd and load the psutil plugin that way. With all those options outlined, we’ll move on.
With Snap installed, we can start the daemon and load a collector. This time we’ll use the psutil plugin:
$ cd ~/Desktop/snap-v0.14.0-beta/bin
$ ./snapd -t 0 &
$ ./snapctl plugin load ../plugin/snap-plugin-collector-psutilDisclaimer: these paths are relative, so be sure to point to wherever you put snapd and the plugin.
Snap is running and loaded with the only plugin in we need for this example. Let’s get Grafana up locally. If you’re comfortable with Go development, you can build from source:
$ go get github.com/grafana/grafanaOr if you have the good fortune to be on OS X, use homebrew:
brew install grafana/grafana/grafanaGrafana has an app model to extend its functionality. We need the Snap App ( source), which is easily installed on the command-line:
$ grafana-cli –pluginsDir=”/usr/local/var/lib/grafana” plugins install raintank-snap-appinstalling raintank-snap-app @ 0.0.3
from url:
https://grafana.net/api/plugins/raintank-snap-app/versions/0.0.3/download
into: /usr/local/var/lib/grafana✔ Installed raintank-snap-app successfullyRestart grafana after installing plugins .
$ grafana-server –config=/usr/local/etc/grafana/grafana.ini –homepath /usr/local/share/grafana cfg:default.paths.logs=/usr/local/var/log/grafana cfg:default.paths.data=/usr/local/var/lib/grafana cfg:default.paths.plugins=/usr/local/var/lib/grafanaAnd we see from the output that it installs the app and is up and running:
2016/06/28 10:32:47 [I] Starting Grafana… truncated … 2016/06/28 10:32:47 [I] Plugins: Adding route /public/plugins/raintank-snap-datasource -> /usr/local/var/lib/grafana/raintank-snap-app/dist/datasource
2016/06/28 10:32:47 [I] Plugins: Adding route /public/plugins/raintank-snap-app -> /usr/local/var/lib/grafana/raintank-snap-app/dist
2016/06/28 10:32:47 [I] Listen:
http://0.0.0.0:3000Now we can
login to Grafana at port 3000. From there:
- Click the top-left icon and open Plugins
- Click the Apps tab, open Snap App, Enable it
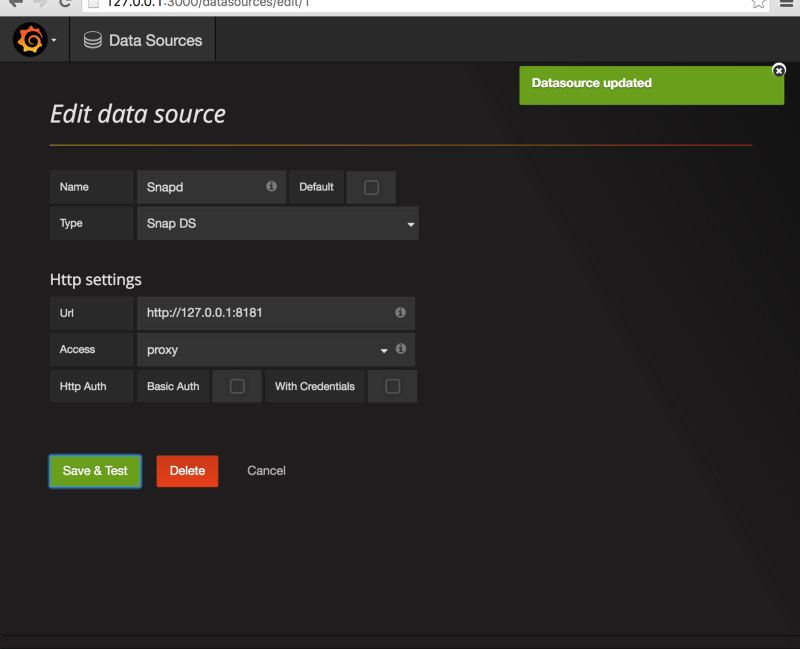
- From the top-left icon again, go to Data Sources
- Add a new data source of type Snap DS pointing to your snapd instance (including port, which is 8181 by default)
- Start a new Dashboard with a Graph panel, select Snap DS as the data source
- Create the task! Name it, choose an interval and metrics, then start it
- Click watch to see live data stream from Snap to the graph just like you would using snapctl task watch
 By taking these steps, you configured a Task in Snap all through the API.
I’ve already wrote about how Tasks are a powerful abstraction for telemetry, but they take on a life of their own once you bring them to a GUI like Grafana.
What will you measure next?
Telemetry is exciting when you have the right data in the right format and sent to the right places. I would love to see more examples of what you measure for day-to-day Ops. If there isn’t a collector for it in the Plugin Catalog, I would love to see you build your own!
This article was originally published on Medium