Snap has been a beautiful CLI-based tool for 4 months now. I shared how to get up and running last time and there’s more command-line tutorials to come (or you can always checkout the README). Today, however, is a special day for a totally different reason.
 The awesome graphic of Grafana and Snap’s new mascot, Snappy the Snapping Turtle.While we all love CLI, we’re all visual creators in the end. That’s why this post hypothetically gets 94% more reads because it has pictures (
source).
The awesome graphic of Grafana and Snap’s new mascot, Snappy the Snapping Turtle.While we all love CLI, we’re all visual creators in the end. That’s why this post hypothetically gets 94% more reads because it has pictures (
source).
Visuals engage us, and from a practical standpoint, visualization scales. I would rather review a dashboard of 10 servers over running top across each of them any day. That’s why I’m thrilled to say that **Grafana’s upcoming release includes interactive administration over Snap **daemons, plugins and tasks.
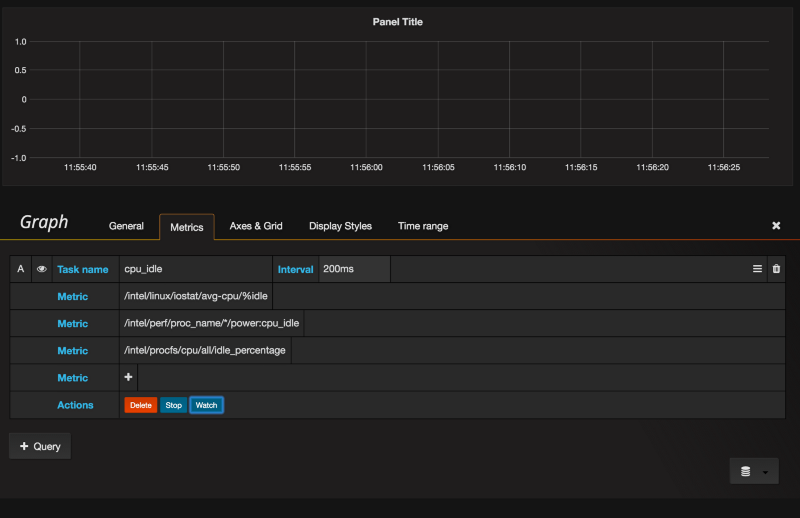 Me configuring a Snap task that watches CPU idle time across multiple systemsThere are two particularly cool parts of this announcement:
- Anything Snap can measure can be made immediately visible in Grafana
- Anything you’re troubleshooting in Grafana can be immediately measured at greater depth through Snap Anthony from raintank writes about this ad hoc approach to troubleshooting that’s powered by Snap. His emphasis hits one of the key reasons the team took this journey in the first place: telemetry frameworks need a unified API.
Everything that talks to Snap, whether *snapctl *or other, uses the RESTful API to do so, enabling a consistent method of administration over the growing amount of data it can collect. All behaviors can be queried over an endpoint. From listing plugins to creating new tasks or even watch running tasks collect telemetry: it’s all there in the API.
This consistency leads way to the Snap Data Source that allows Grafana to stream any metric live, at high resolution, directly from your Snap servers without leaving Grafana.
“Combining Snap’s watch feature with Grafana Live provides a new twist to ad hoc queries. Not only can the query be ad hoc, but the actual telemetry data being collected can be ad hoc.”This all comes out at part of Grafana.net the Open SaaS platform the team at raintank has announced today. The Snap Data Store source code is here if you’re curious. We’re really excited to see the raintank team use Snap in this way. You should definitely check out co-founder Anthony Woods’ deep dive on the topic and share your thoughts with us.
Collect from more sources with new plugins
While the team at raintank developed Snap into a data store, our small team continued to expand the breadth and depth of metrics gathered by the framework. We created 24 new plugins coming to the Snap framework this week, adding tons of value to our growing ecosystem. A couple highlights:
- We add MySQL & kairosdb publishers to our growing list of databases
- We join the OpenStack ecosystem with Cinder, Nova, Keystone and Neutron collectors
- Even more OS statistics ranging from CPU numbers to a list of logged in users or processes And the list is continuing to grow. I had some fun thoughts about use cases based on all these. You can collect usage statistics from NFS servers along with your system stats to find what’s slowing your down your NAS. You can keep an eye on stats from your HAProxy service and the Docker contain it runs in. You can collect statistics from RabbitMQ and publish it to RabbitMQ (because why not?). Snap is expanding its usefulness no matter your workflow.
You can see the full list of plugins in the Plugin Catalog and download the latest release of Snap, v0.13.0.
I hope to see you jump in with both feet and start using Snap and visualizing it with Grafana.net. If you need a hand along the way, don’t be shy about reaching out.
This article was originally published on Medium