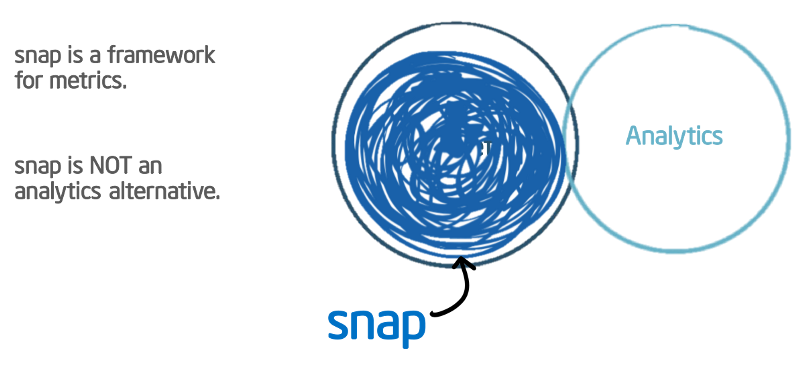
Snap is titled “the open telemetry framework.” I’ve been focused on getting us all comfortable using Snap, but I (rightfully) keep getting asked the bigger question.
What is Telemetry?
Telemetry is the stuff you can measure and the process of capturing it: from the heat generated on a CPU core to the throughput of Nginx running in a Docker container on a Kubernetes cluster. It’s all measurable and it’s all summarized in that one word.
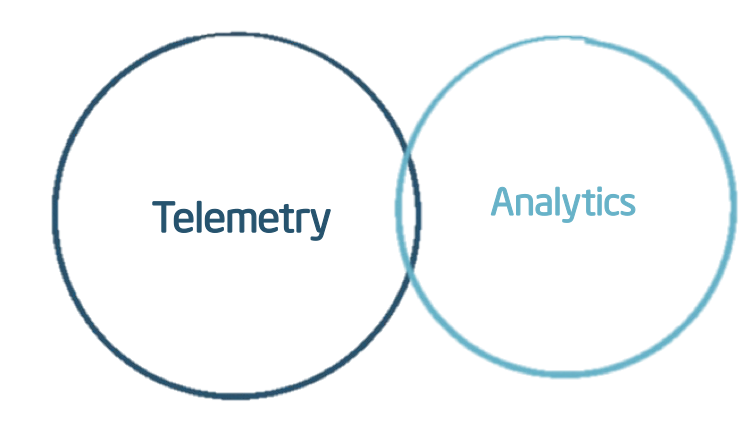
 Telemetry and Analytics are part of a common goal, but they hold distinct places in the process.Telemetry is awesome once we differentiate it from other terms. Here is how I separate it out, with some help from
Webster:
- Telemetry — the process of using equipment to take measurements of something and send them to another place
- Metrics — measurements of facts throughout the data center
- Analytics — the method of logical analysis that determines the consequences of information Telemetry is a superset of what we are used to calling “metrics:” measurements of facts throughout your infrastructure that includes the process by which its collected, processed and published to somewhere.
 Snap’s major value comes in its one API for all telemetry.These facts we want to gather are everywhere. They come in the form of flags in /proc (which is
fun to explore), CPU temperature levels from Intel Node Manager (and its
plugin), or tallies of networks counters from ethtool (through the Snap
plugin) and that’s just part of the story. All types of hardware and every layer of software has a story to share. The telemetry in your data center is massive in breadth and depth when you consider the diversity of information you care about and the many layers of tech used in your applications.
No value is derived from telemetry without analytics. Said another way, process of collecting and publishing metrics does not lead to value until it’s analyzed. To know what’s most effective as an indicator, you often have to gather much more information than is immediately available. The challenge of doing so can be a fun experiment, digging into new APIs, time-series databases and every little indicator along the way.
 A literal piles of metrics.All that said, telemetry gathering is not for the fun of having the numbers. There are amazing stories of companies achieving massive profits from understanding their systems.
GE is noted as saving $1 billion over 5 years by understanding their data. I find it fascinating how
Target optimizes its marketing through analytics. Many more companies in industries far outside of obvious “Software Companies” categorization will benefit from the same, especially when it’s easier to do in your own data center.
That’s a big part of it, too. What you want to measure and how you measure it has not been, historically speaking, simple. It’s actually a huge pain. Every potential indicator has its own set of tools that don’t necessarily fit into other tools. That’s a pain the Software Defined Infrastructure team at Intel has observed and decided to simplify with Snap.
Standardizing on a single API
By standardizing telemetry, we can enable greater democratization of metrics, leading to valuable analytics.
Snap is about the simplification of how to manage telemetry. Every layer — even every piece of hardware! — had its own opinionated view of how to expose this data. There have been tools out there that can consume it (from collectd to heka) and common pipelines to do so (see Monitorama presentations for some of the most thoughtful), but there hasn’t been a lot of attention on improvement. We want you to gather statistics from your data center so that you can build smarter, better utilized systems.
That’s a large reason why Snap, the open telemetry framework, was created. The team took the best behaviors of collection tools and standardized how it could be done across all cases.
If metrics in all their unique forms interest you, get involved in the project or just hangout with us in Gitter. We would be happy to have you involved.
This article was originally published on Medium